
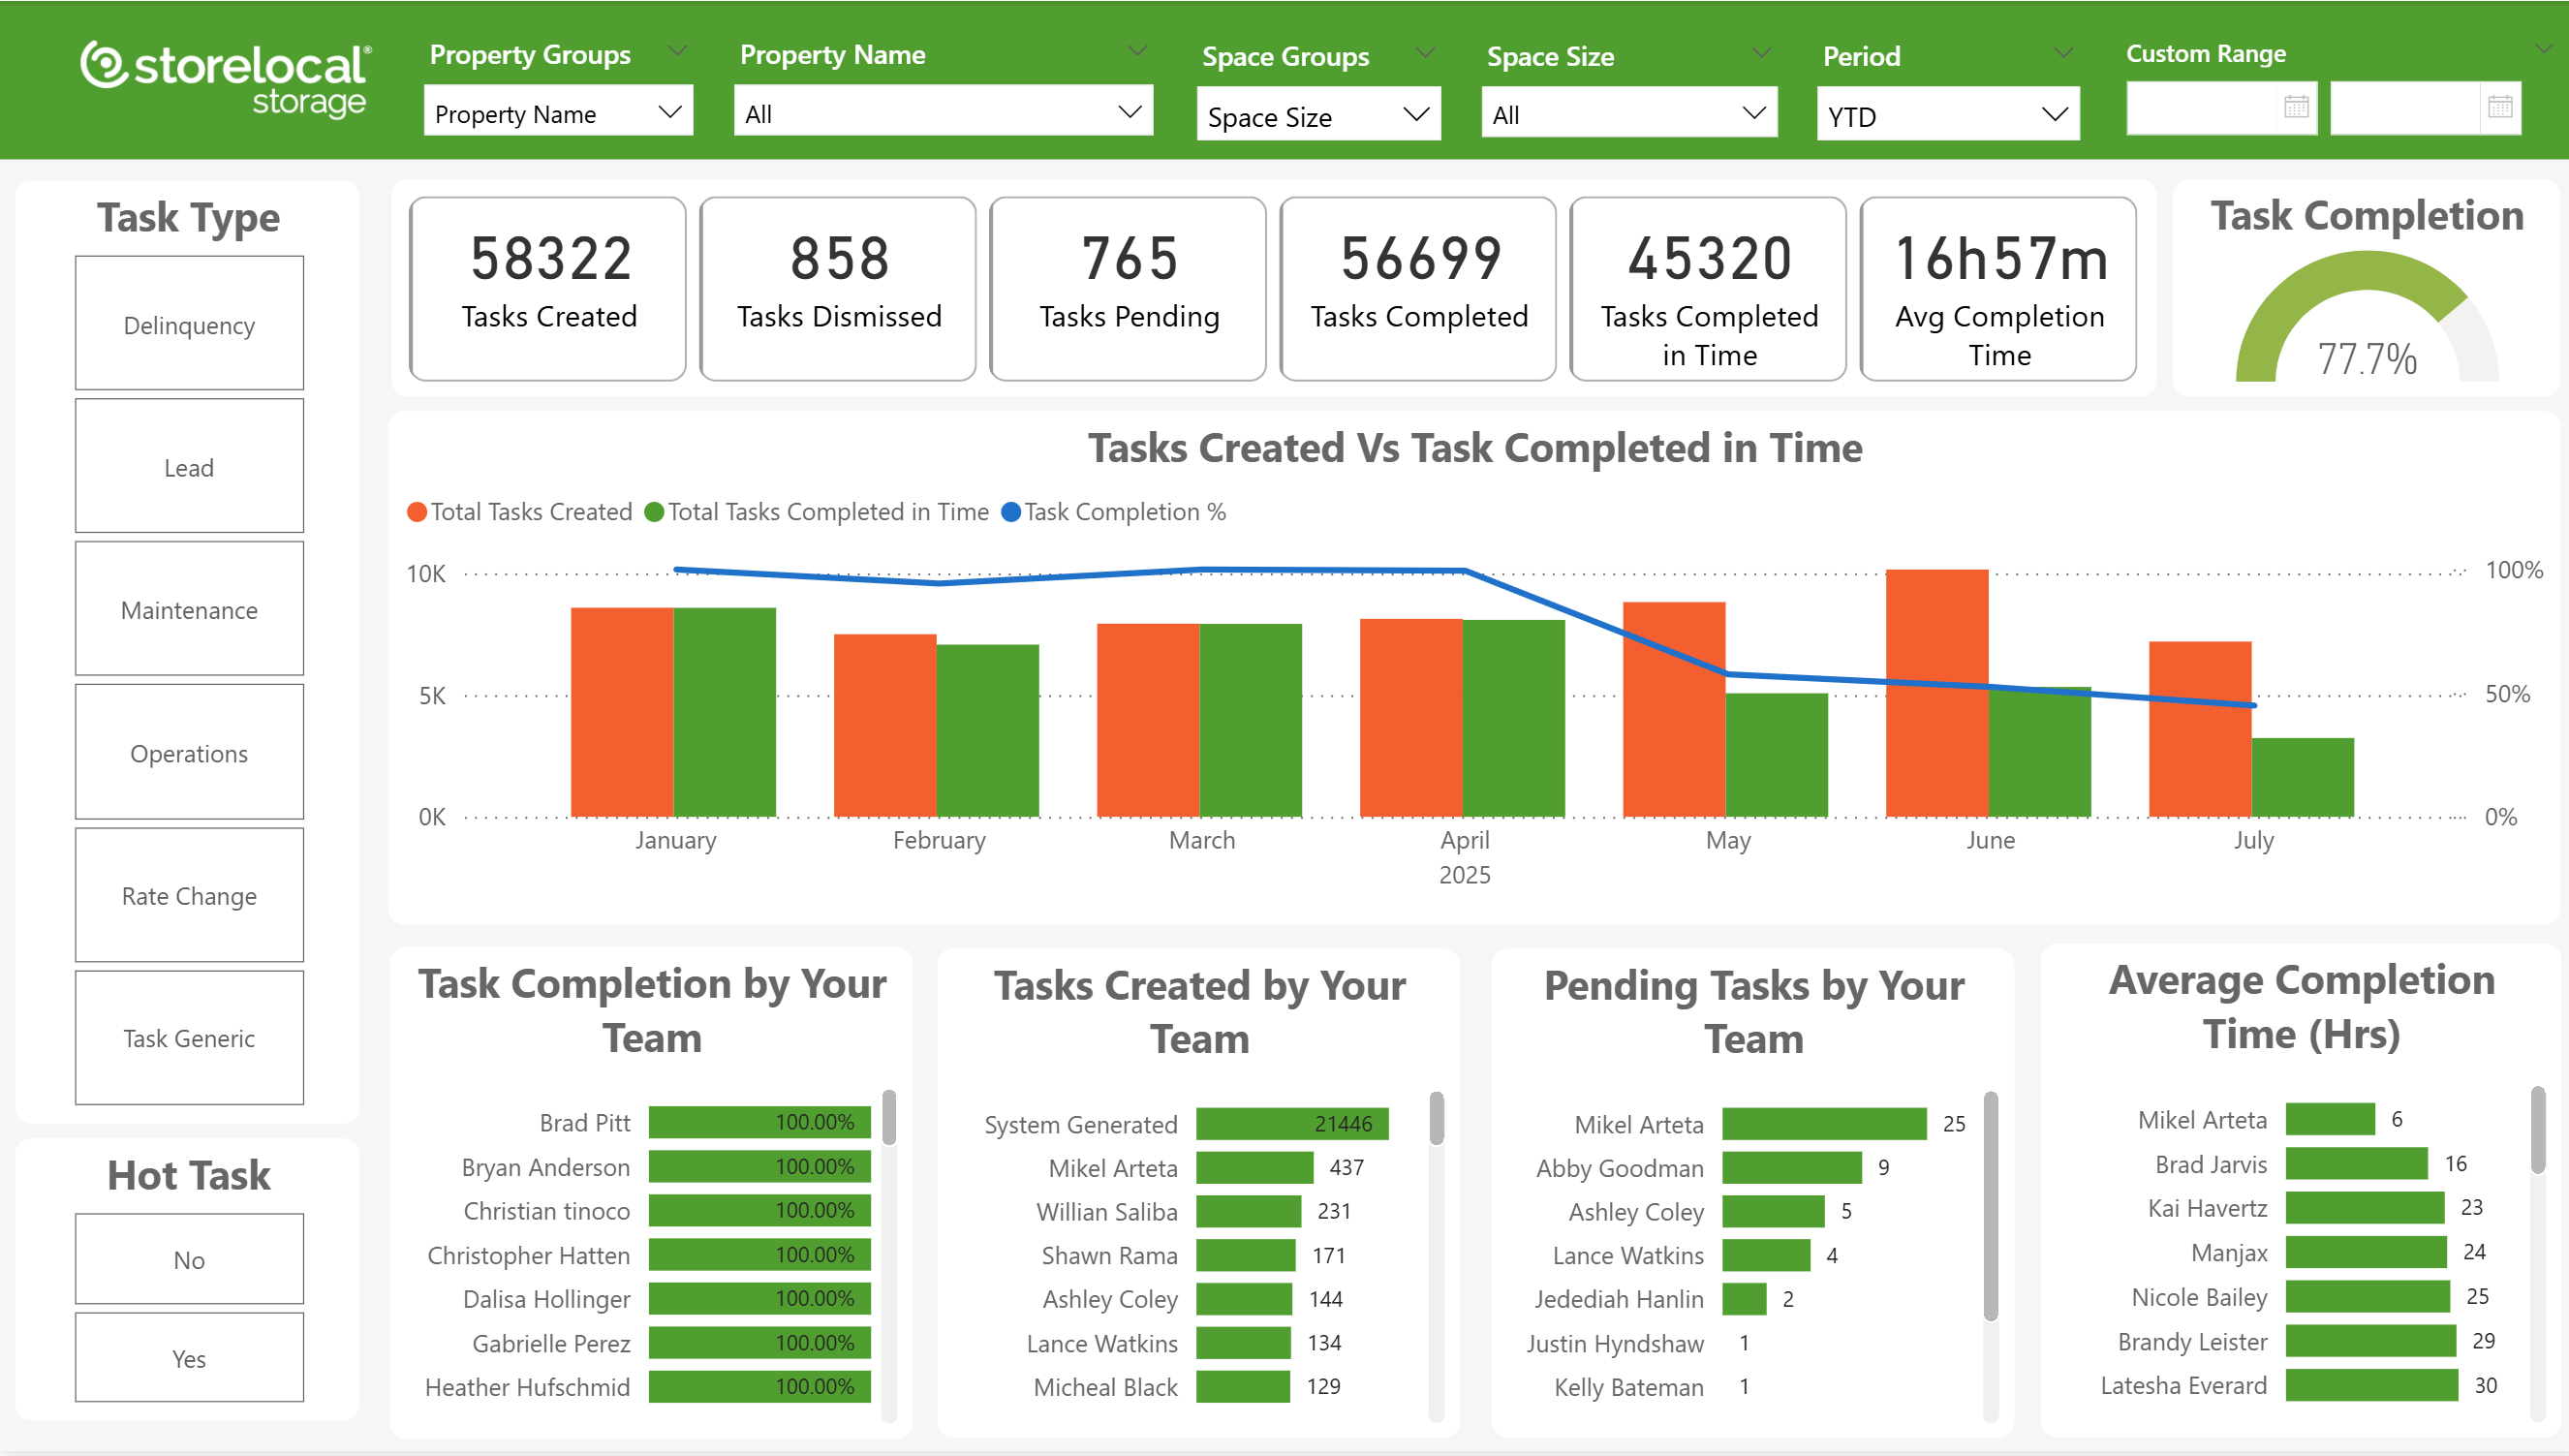
We’re excited to announce the launch of our new Task Manager Dashboards, designed to give teams and operators a clearer, more strategic view of how tasks are created, completed, and managed across the portfolio.
Until now, task tracking has often been reactive—focused on individual to-do lists or siloed task reports. With this release, we’re bringing structure, visibility, and accountability to the entire task lifecycle.
Why It Matters
Every task completed (or missed) is a reflection of team execution and operational discipline. This dashboard turns task data into business intelligence—helping you monitor trends, set expectations, and drive performance.
You can now:
-
Track overall task volume: created, dismissed, pending, and completed
-
See how many tasks are completed on time, and how long they take on average
-
Visualize completion trends by month to understand whether performance is improving or slipping
-
Quickly spot bottlenecks by viewing pending tasks by team member
-
Celebrate execution with team-level completion scores
How It Works
The Summary Dashboard gives you a high-level view of key metrics like total tasks created, completed in time, and overall task completion rates. Visuals like the completion gauge and trend charts make it easy to evaluate performance over time and across locations.
The Detailed Dashboard lets you drill into individual tasks with full filtering by property, team member, task type, and date. Whether you want to audit a single overdue task or understand workload by site, it’s all accessible in one place.
What This Means For You
This is more than just reporting—it’s a performance tool.
You now have the ability to monitor accountability, identify gaps, and reward excellence. Whether you're managing one store or fifty, this dashboard equips you with the clarity and confidence to make smarter, faster operational decisions.
Task management just got smarter—and more visible.
Ready to see it in action?


.png)
.png)